Tracing roads, buildings, water and landuse
Reviewed 2016-02-08
Following on from the Remote, Armchair & Mapathon Section of LearnOSM section, which you will need if you have no experience of mapping for HOT.
Section Index
Roads and Highways, including paths & Tracks
The Highway network
Residential Landuse boundary
Buildings, walls, fences, compounds and barriers
Roads
Any type of roads from motorways to tracks and paths are labelled ‘highway’ in OpenStreetMap. It is important that highways are correctly added to the database (OpenStreetMap data) as they are used in so many ways:
- Navigation software such as Garmin devices and apps. on smartphones such as Osmand can provide routing information over great distances if the correct information is loaded into them. As these rely on the gps within the device to locate the position in relation to the basemap loaded into them, it is important that the highways are actually within about 15 metres of the right place, or they will not work!
- Planning the route for a large ‘aid’ lorry is much easier if you can differentiate between a path & a trunk road, with all the stages in between.
- Knowing whether a road surface is asphalt or soft mud will make a difference to your route planning.
- When attempting to plot the spread of a disease, a victim’s description of “near the crossroads” is significant if you can see the crossroads on the map.
Highways - How to map
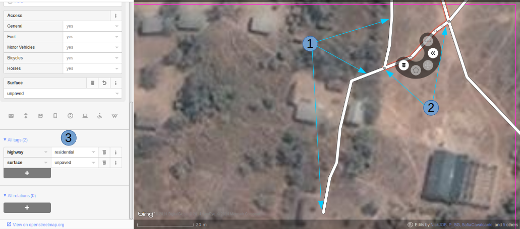
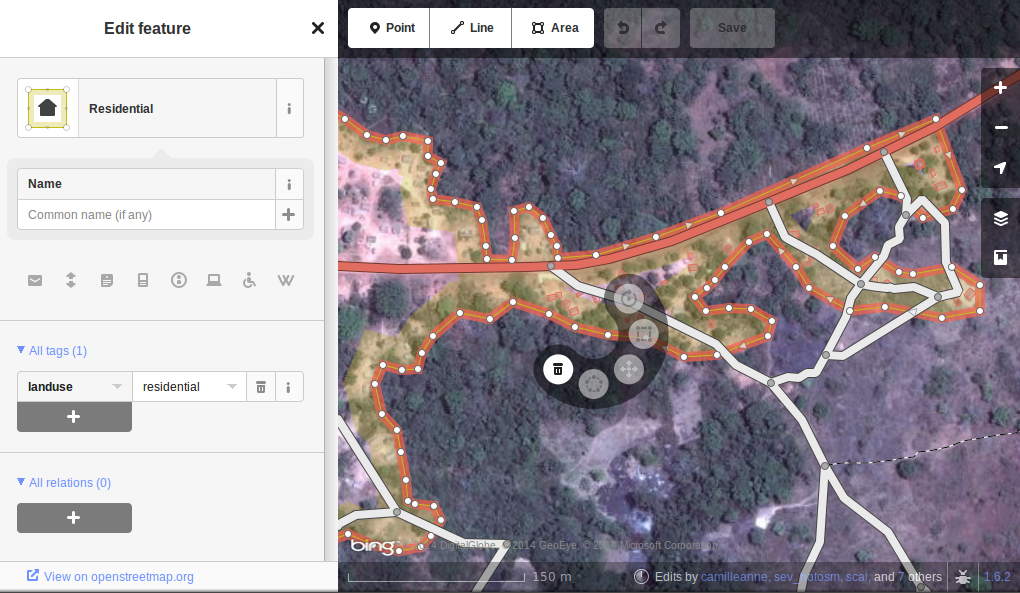
- When tracing highways, ensure you are zoomed in sufficiently. As a starting guide set the scale to about 20 metres, and trace the highway so that your tracing has sufficient points in it to keep it on, or very close to, the road you can see in your satellite imagery. In the screenshot above you can see I have traced the road that had been passed over to me, down, through the trees, and down to another building where it appears to stop. Where the trees are close to the road, and the imagery is obtained by an overhead camera, it appears as if the road narrows as it goes through the trees - however, it is just the effect of the trees obscuring the view, and the road is the same width throughout.
- I’ve also traced another section of road, making sure that it is connected at each end - iD shows this with a slightly larger and darker coloured dot at the junction. It is important that the roads join and ‘share a common node’ so that routing software will provide the correct guidance.
- The road is tagged as ‘highway=residential’, and I’ve also added ‘surface=unpaved’.
- For a full description of tagging within Africa, refer to the wiki page Highway Tag Africa.
There is a high risk of suffering from conflicts which will prevent you saving your work when working on any highway which extends into other squares where mappers will also be editing it. It is advisable to save all your changes before editing the highway, and then save your changes at very frequent intervals, such as after adding each 6 nodes.
The Highway Network
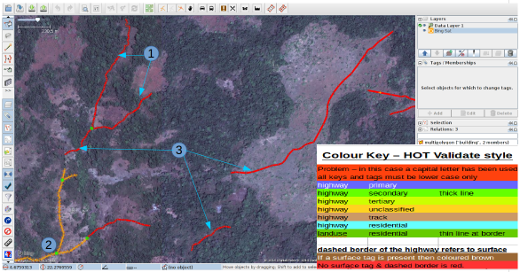
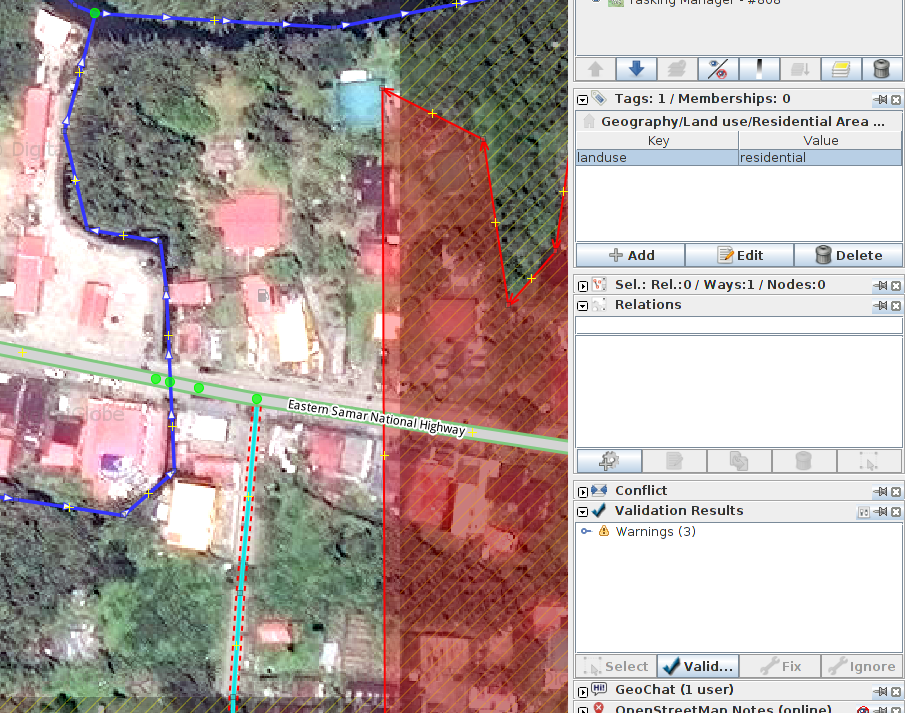
This screenshot shows JOSM with the HOT-OSM-Validate style in use JOSM styles. Although designed to assist validators, it can be very useful when carrying out initial mapping. Anything that is coloured red has some kind of problem - the remaining colours are explained in the key in this screenshot.
- This section of highway is coloured red because the tag has been incorrectly typed and a capital letter has been used. The tag should be highway=unclassified, which would have resulted in a pale brown colour in the screenshot.
- This is part of the highway network for the town to the South West.This network connects to the rest of the highway network of Africa.
- These sections of highway are ‘isolated’. They do not connect to the town or to an other highways in any way. In their current format they are not very useful & will need further investigation to establish if they can be connected to the rest of the network, or if consideration should be given to deleting them.
Highway or stream?
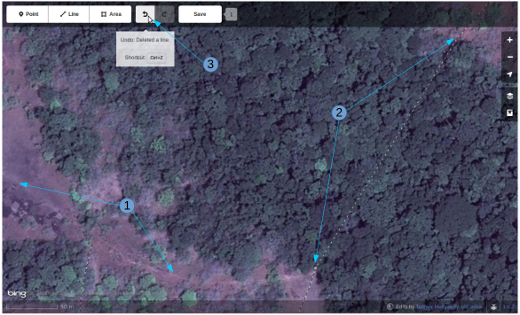
There are no style views available to assist in using iD, but in this screenshot you can see an area of vegetation and ground. The ground appears to be silt or perhaps even an area of marshland without the water present. The dotted black and white lines represent paths in iD & I have temporarily highlighted & then deleted one of them to show the terrain.
- highway=path or stream bed. Probably both! highways of all sizes frequently follow a river valley and in many cases they may follow the course of a seasonal river or stream. In this case this appears to be a flood plain area which at the time the satellite imagery was produced was dry, and being used as a path. This would be best tagged as:
highway=path
seasonal=yes
surface=unpaved
- The path can be clearly seen going towards and into the band of trees and shrubland, but it is not possible to see its exact course through the trees. In these circumstances you can be certain the path, track or highway is present, it is just obscured from your view by the trees. I have mapped this by continuing the path I was tracing where it could be clearly seen on the ground as a straight line through the trees to the clearly visible continuation on the other side. Use this with caution, but in this instance it is obvious that the path is present and its path is likely to be very close to the line I have drawn. This is a more extreme usage - it is more usual to estimate the path of a highway for only a few metres where your view of it is obscured by one or two trees.
- Having deleted the path so that I could see the ground clearly, I can easily replace it by using the ‘undo’ feature of iD.
Residential Boundaries
Residential boundaries are used for many purposes in OpenStreetMap.
- The simplest use is to be able to see residential areas at higher zoom levels when viewing OpenStreetMap.org, where they are coloured pale grey in the standard view.
- Where there is not time to map in detail from the outset, the project within the Task Manager will frequently require something similar to this:
Map essential infrastructures such as schools, place of worship and markets.
Trace outbound of settlements and cemeteries.
We will trace roads later in an other Task.
- landuse=residential can also be used for statistical purposes, and accurate mapping then becomes important
- If you can establish how many people normally reside in each dwelling, and
how many dwellings are normally built in a given area, then
once you have worked out the area covered by a landuse=residential boundary,
you can establish a very approximate population for that area.
Estimating the number of aid workers & quantity of medicine now becomes more realistic.
- Place names & boundaries are often imported from other sources, but the location is not always accurate. Once you have a residential boundary the person doing the import can see where the place name should probably be.
landuse=residential - how to map
** In an ideal world **
Stage 1 - A decision is taken to map an area, and a mapper quickly puts a very rough landuse=residential boundary around an area,
Stage 2 - The Task Manager project is created & the individual mappers refine the boundary so that it is closer to the buildings etc.
The iD & JOSM screenshots above show a correctly mapped landuse=residential boundary.
- The boundary needs to be closed, so that the start point of the line (way), joins to the end point.
- The segments and nodes of the boundary should not join highways, waterways, buildings, or any other feature. i.e. it should not share any nodes. But they can cross.
- The boundary should be fairly close to the buildings & any gardens or yards that form part of the grouping.
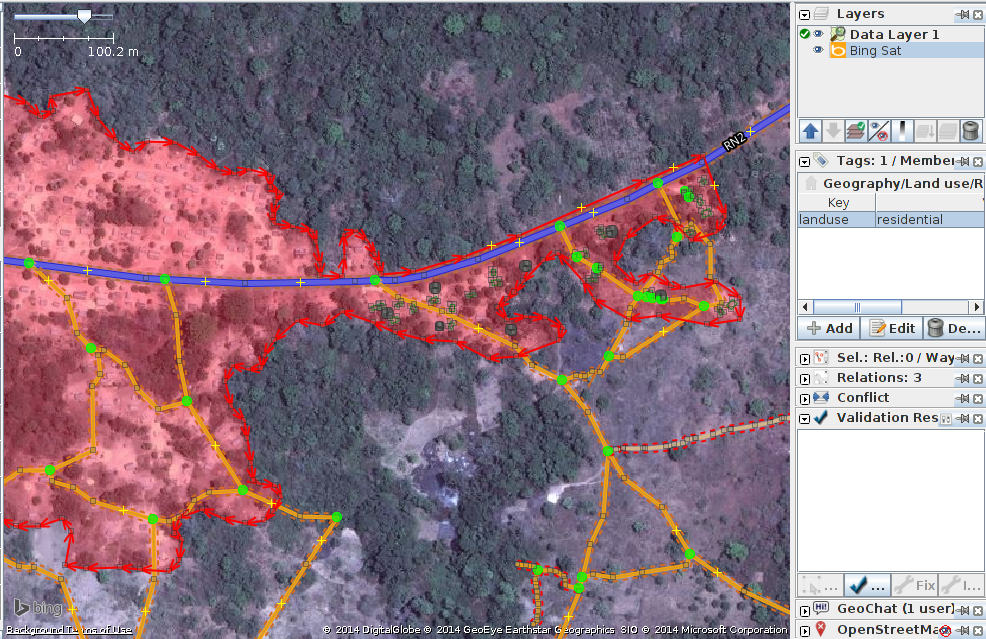
In the screenshot below, my square contains part of a landuse=residential boundary. The person who completed the square to my right has continued a landuse=residential boundary through their square, and has then correctly ‘handed it over’ to me by placing the boundary just within my square for me to establish exactly where it should be in my square.
I will add extra nodes to the boundary, extending it horizontally across my square so that it goes around the buildings , and at the bottom I will continue the boundary as a straight line just inside the square below mine so that the person selecting the square below mine will be able to extend it around any buildings they may have.
This is a difficult operation - you can see only a small part of the whole town / city / village and although you will do your best with the landuse=residential boundary it is extremely likely that a validator who has an overview of several squares will need to tidy up the boundary as best they can after the individual squares have been mapped.
There is a high risk of suffering from conflicts when working on a landuse=residential boundary, as it extends into other squares where mappers will also be editing it. It is advisable to save all your changes before editing the boundary, and then save your changes at very frequent intervals, such as after adding each 6 nodes.
Buildings walls compounds barriers
Buildings are added to the map data for a number of reasons;
- The density of buildings in an area gives a very good indication of the number of people residing there.
- The size, shape & location of a building can help to identify it as a potential evacuation or treatment site.
- The size, shape, and relative location of buildings can be used to identify particular locations such as wells, aid stations, schools, etc..
- There is the potential to estimate the degree of damage sustained by a building, which can be used to estimate the potential casualties & level of support that may be required - this is currently (January 2015) under discussion for future use.
Buildings - How to Map
The vast majority of buildings that require mapping by HOT are either based upon rectangular shapes with square corners, or are round. If a building appears to be a mixture of the two, it is more likely you are looking at a building who’s outline is obscured by shadow, reflection, foliage or similar.
For some tasks where only an outline of an area is required, the task may specify that buildings can be mapped as nodes, but these situations are now rare.
building=yes
Unless the project instructions specify otherwise, buildings should be tagged building=yes
- There can often be a time delay between the satellite imagery being taken, and the mapping being carried out. There is the possibility that the building you are looking at that appears to have no roof, has now been completed & is now in habitation. It is also possible that you are looking at a building with several storeys, the bottom ones being lived in, and the top floor with no roof currently not being lived in.
Mapping buildings using iD - when you are using the area tool within iD to create the basic shape, you must remember to then change the tag to building=yes. The default setting will merely tag the shape as area=yes. If you’re tracing is of a building with square corners, please take the time to square your traced item (highlight it and shortcut ‘q’).
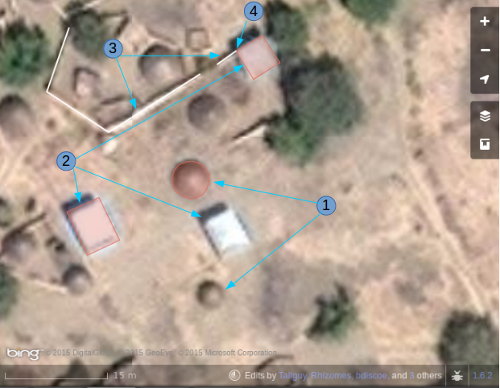
This screenshot shows part of a square being edited. Note the scale at the bottom of 15 metres - about the figure you should aim at when editing features. When tracing, you are aiming to place the building where it meets the ground:
- Round buildings. In this case they are fairly low in height and their shadow is hardly visible. If you were standing amongst them they would appear like domes. I have mapped & tagged only one of these so far building=yes. To quickly add the remaining round buildings in JOSM or iD I would select this one (highlight it), keyboard shortcut Ctrl+c, move my cursor to the centre of another round building of the same size, keyboard shortcut Ctrl+v. When all of the round buildings of this size have been added in my square I paste a building over a different sized round building, JOSM - use Alt+Ctrl & mouse to resize it to the correct size, copy it & then paste over all round buildings of the same size.
- Rectangular buildings. These particular buildings are casting a noticeable shadow. The shadow can help to identify the shape of a building which is partially obscured by another feature. You will find that many buildings are not so simple, and have a verandah or are ‘L’ shaped - you must trace the actual shape of the building as this will help to identify it when names & other data is being added as part of the ground survey process.
- Barriers - walls (or hedges) of a compound. Having examined the imagery, zooming in & out until I am satisfied that from the shape of the object (use its shadow as well to identify), I believe this to be a wall, and I have tagged it barrier=wall. Alternatives include barrier=fence and barrier=hedge.
- I have joined the barrier=wall to the building=yes at the corner of the building.
Satellite imagery distorting the building shape.
-
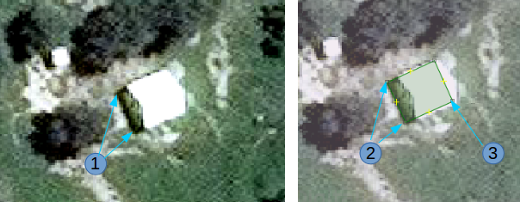
The satellite imagery above, is of a building, but the satellite was not directly overhead, so that the building appears distorted and an end wall is visible in the image. Because of this angle, the apex roof does not appear rectangular. The sun is practically directly above the building, so that the shadow of the building indicated by the arrows from figure 1 does confirm that the building is rectangular.
-
To map this building, create a rectangle extending from the arrows of point 2, to where you estimate the building ends, indicated by point 3 in this image.
More to follow - see the below links for more guidance.
Further Reading
