|
|
Reviewing OSM Data
This section covers processes for checking data quality, particularly in the context of a directed OSM mapping project, such as those undertaken by the Humanitarian OpenStreetMap Team in various countries and Open Cities projects in Bangladesh, Sri Lanka, and Nepal. The methods demonstrated may be useful in other contexts as well, when data quality review is a regular task. When we are trying to map a complete set of features and attributes in a specified area, we need ways to check for mistakes and ways to assess the accuracy of the work. In this tutorial we will work through several methods of checking data, explaining the steps of the method and the reason behind each. A well-managed mapping project will include each of these three processes, both for evaluating and correcting data and for reporting.
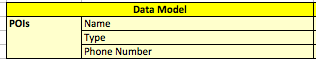
These methods of review become more important as the data model grows and the number of features collected becomes quite large. For example, it would not take a lot of time and effort to assess a data model which only involves points of interest (POIs):
In this case the questions to ask would be:
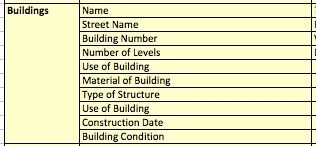
Usually a data model is far more complex, however, as in the case with mapping buildings. Consider a data model that includes this:
Now you may be mapping thousands of buildings that have many attributes, and the analysis becomes more critical. In this tutorial we will use buildings as an example, though the same methods can be applied for reviewing other types of features too. Daily ChecksThe most immediate way to check data is to review and validate it on a regular basis. This could be daily or at most weekly. For the supervisor of a team of mappers, this is an important task because catching mistakes and bad editing practices early means that they can be corrected and the editors can learn to do things properly. Here we will look at some methods for checking data simply using JOSM. Some of the questions we are asking about our data are:
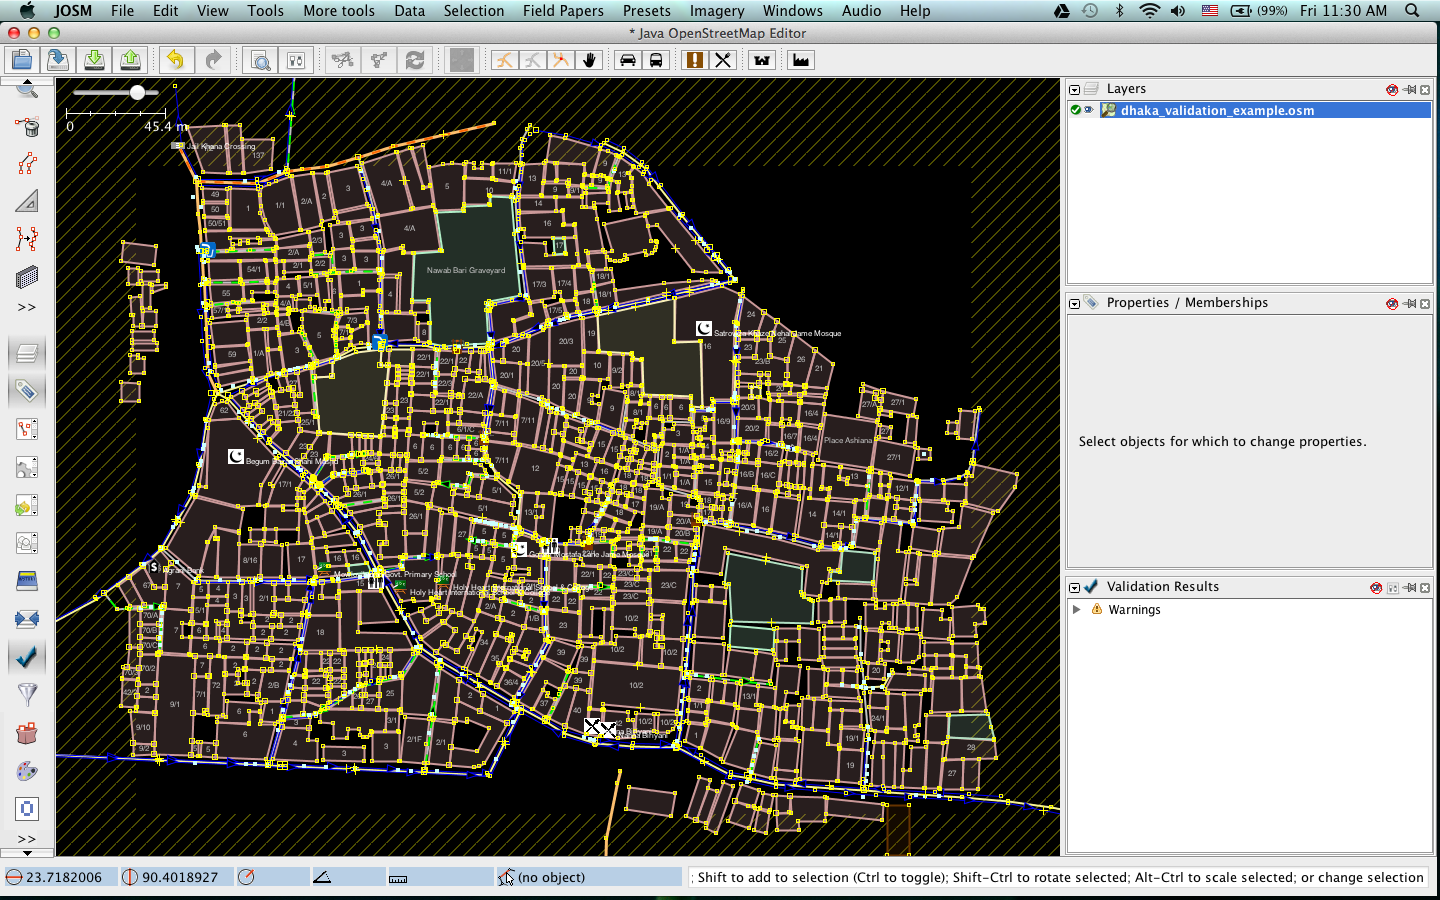
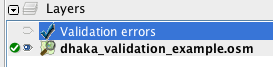
Let’s examine how we can find answers to these questions in JOSM. We’ll assume that we are examining the work of others, but the same processes will work fine (and should be easier) when analyzing your own work. We will be using an example data file from the Open Cities mapping project in Dhaka. To follow along, download the following file: dhaka_validation_example.osm DO NOT try to save your changes on OpenStreetMap. These exercises are for demonstration purposes only.
Data ValidationThe first step for checking data is to run the Validation tool in JOSM, which will automatically check the data you have open for suspected mistakes. This tool is especially useful for finding topology errors but may not be as useful for finding incorrect tags.
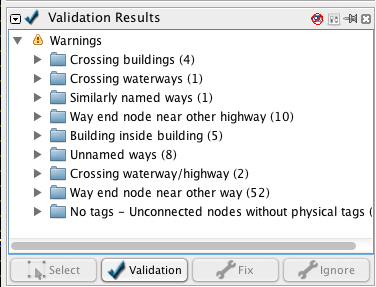
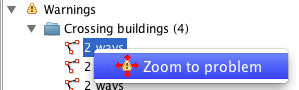
Let’s look at a few of the warnings. You can see that there are four “Crossing buildings” warnings. This warning means that buildings are overlapping somewhere. Select the first item in this list, right-click, and click “Zoom to problem.”
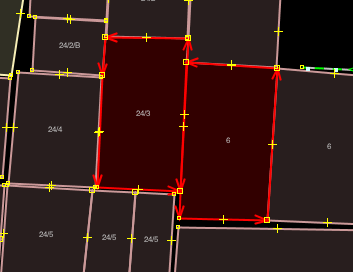
Also, click the “Select” button at the bottom of the Validation window to select the ways in question. This shows that these two ways have a problem:
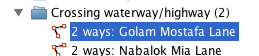
This method of automatically checking the data is an effective way of correcting topology errors, particularly those that would be difficult to notice by a person. In the list of validation warnings, you can see that other warnings such as “Building inside building” is the result of a similar mistake. Still other warnings, such as “Crossing waterway/highway,” are not necessarily mistakes. This shows that the validation tool is good at finding possible mistakes, but it requires someone to go and see whether the error is important or not.
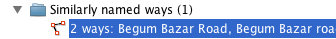
Let’s look at the warning under “Similarly named ways” to see an error that is not topological. Click “Select” to select the two ways in question.
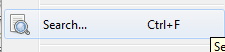
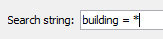
Can you tell what the mistake is? Here we have two different road segments, which are actually the same road, yet they have been named slightly differently - “road” is capitalized on one of the ways but not on the other. It makes sense that they should have the same name, and in this case the word “road” should be capitalized. Using JOSM SearchSearching in JOSM is a powerful way of reviewing data. It allows you to provide search terms, also known as queries, to select only the features that you want.
This is great, but how does it help us review the data? Well, now that all of a single type of feature have been selected, we can look for incorrect tags.
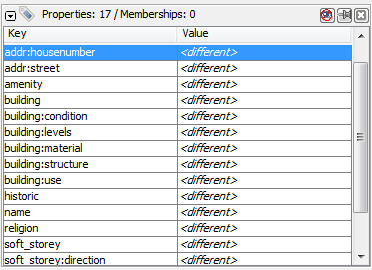
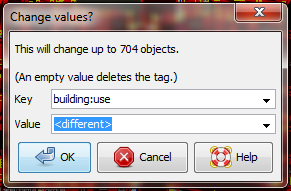
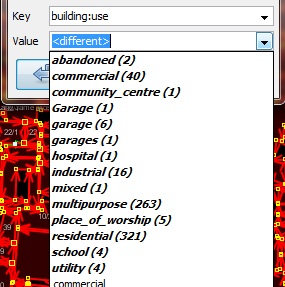
We can compare this with the OpenStreetMap tags that have been mapped in our data model, and look for mistakes. For example, this tag represents the use of the building. Early in the Open Cities Dhaka project (where this data came from) there was uncertainty as to whether a mixed-use building should be tagged building:use=multipurpose or building:use=mixed. Because the former tag had been used previously in other countries, it was selected. However, we see here that one of the buildings has been tagged as mixed. We need to correct this. (Another obvious mistake are the three different terms for garage, but we won’t correct this here.)
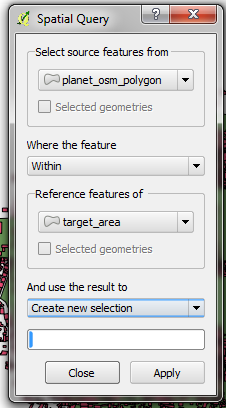
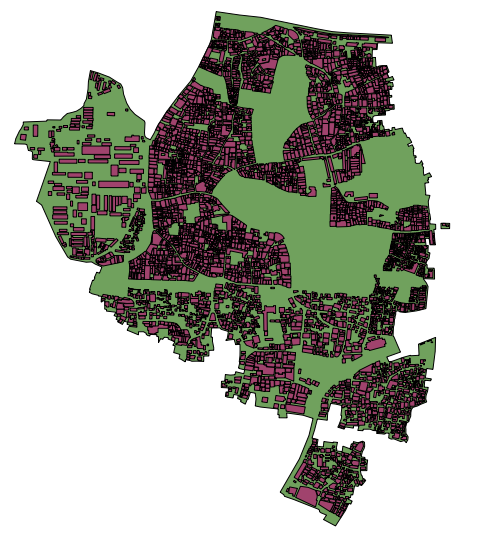
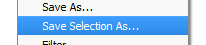
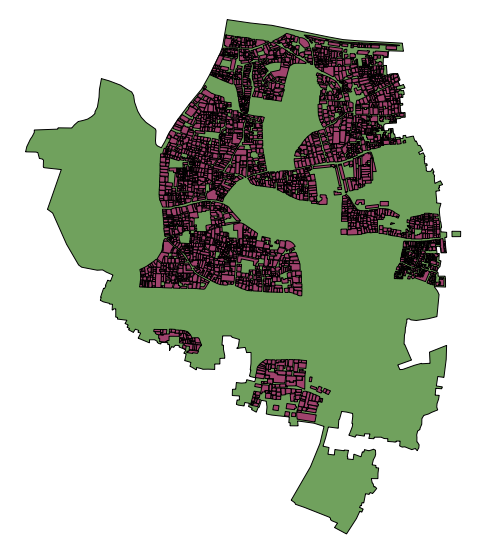
Remember that if you are following along with this tutorial, DO NOT try to save your changes on OpenStreetMap. These exercises are for demonstration purposes only. Re-SurveyingWhen managing a project like a detailed building survey, there ought to be an additional method of quality control, both for improving the work and for reporting on the accuracy at the end of a project. If there are many mapping teams collaborating to survey an area, it is common that one or more of the teams may not do a satisfactory job. Even those teams that do efficient and accurate work will make mistakes. Imagine teams that each map 100 buildings per day - it is not unlikely that a small percentage of the attributes they collect may be incorrect. Thus, a good project will include a process of re-checking some of the work that has been done, fixing mistakes, determining which mapping teams are performing satisfactorily, and approximating the percentage of errors for a a final report. Of course, there is no sense in re-surveying every building in a target area, but 5-10% of the buildings should be reviewed. The areas for review should be chosen from different areas to compare between survey teams. Survey teams can re-survey each others’ work, or if possible more experienced managers can undertake the reviews. It is common practice that one day a week managers will spend re-surveying parts of the target area. Correcting MistakesWhat should be done when mistakes are found? If there is a small amount of mistakes (less than 5% of buildings), the issues should be brought to the original mapping team so that they are aware and may not make the same mistakes again. The data should be corrected in OpenStreetMap and the results of the re-survey should be recorded. If there are many mistakes, bigger actions may need to be taken. The survey team will need to be addressed in an appropriate fashion, and the areas they have mapped may even need to be resurveyed entirely, depending on how inaccurate the data proves to be. Greater than 10% inaccuracy is most likely an unacceptable rate. Reporting on AccuracyThe second goal of resurveying is so that you can report on the accuracy of the data when the project closes. Users of the data will want to know your metrics and methodologies of assessing the data quality. By including this process as part of your reviewing methodology, you will be able to clearly explain how you assessed the data quality, and provide hard numbers that show the likely percentage of error contained in your survey data. For example, let’s imagine that we are managing a project which maps 1000 buildings. So we decide to map 10% of them, or 100 buildings, randomly selected from the target area. We go out and find that of the 100 buildings we resurveyed, six of them have a high level of inaccuracy. Let’s say we define inaccuracy by having more than one attribute incorrect. So six percent of the resurvey is wrong - we can fix these mistakes, but we still must extrapolate that about six percent of all 1000 buildings are probably inaccurate. This should be reported as the probable error at the close of the project. Resurveying ought to be done throughout the project. Imagine that we waited until the end in this example and 40 out of 100 buildings were wrong! It might ruin the entire project. It is better to catch large-scale mistakes early so that they can be corrected. SQL QueriesProbably the best analysis tool is going to be running SQL Queries in a GIS system, such as Quantum GIS. This is similar to searching for data in JOSM, but it offers more powerful analysis, though it can take a little more time to set up. Using JOSM is a quick, regular way to check for basic errors, whereas querying in QGIS is better suited for finding missing data or incorrect attributes. We’ll assume here that you are somewhat familiar with GIS, and focus on building queries which can help you to review OpenStreetMap data. For the exercises below we’ll again be using data from the Open Cities Dhaka project, which you can download at dhaka_sql.zip. The OpenStreetMap data was exported using the HOT Export Tool (export.hotosm.org) and the target area boundary was defined at the start of the project. Prepare the DataUnzip the files and load the two shapefiles into QGIS. We’ll begin by clipping only the buildings within the project area, to make our queries more simple later on.
“building” != NULL AND “source” = ‘Open Cities Dhaka Survey’
SQL QueriesWe can now run queries on the buildings layer to find possible mistakes. Let’s think about some things that we might want to query. The data model from this project indicates attributes that should be collected for every building - they are:
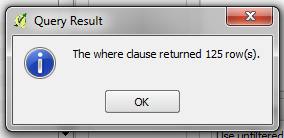
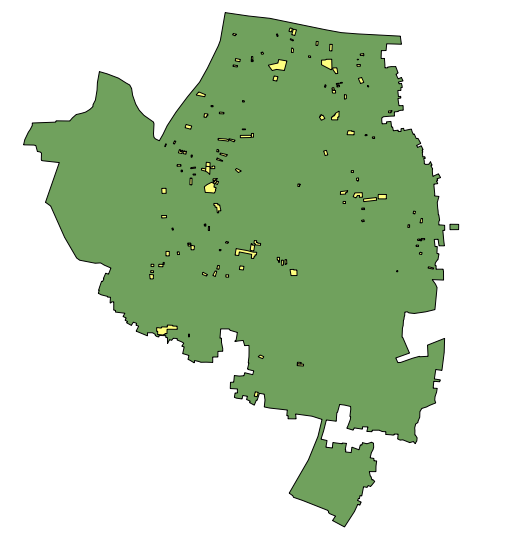
Note that in the shapefile these attribute names are truncated, since column named are limited to 10 characters. So what sort of questions do we want to ask? What are likely mistakes? One common mistake is that a building was mapped, but not all of the attributes were collected. So we will want to run a query that shows all the buildings which do not have a complete set of attributes. Of course, for some attributes, like name and start_date (construction year), it is perfectly fine for them to be empty, because not every building has a name and sometimes the construction year is unknown. But the other attributes should always be collected. Let’s try to develop a query for this:
“building_c” = NULL OR “building_s” = NULL OR “building_l” = NULL OR “building_m” = NULL OR “vertical_i” = NULL OR “soft_store” = NULL OR “building_u” = NULL
What are some other queries that might be of use? Well, you may also want to check for attributes that are not contained within your data schema. We did this in the JOSM search section. You can use a query to find all the buildings whose attributes don’t fit within your data model. You may also use this to look for anomalies, which are probably but not necessarily mistakes. For example, if we open the query builder, select building_l, and click “All” to load all the possible attribute values, we see that most buildings have a number between one and 20 (This attribute is building:levels, the number of storeys in the building). But there is also a 51 in there. It seems unlikely that there will be a 51 storey building towering above everything in this area, so we can locate it and make a note to check this with the mappers. Querying can be an effective way to look for possible mistakes in the data set. Combined with other features of QGIS, it can be used to output maps that can be used for reviewing the data in an area. SummaryIn this tutorial we’ve gone through several effective methods of maintaining data quality during a project and done some hands-on exercises to practice reviewing OSM data. When organizing a mapping project, or even when assessing the data in an area for personal use, these methods may come in handy.
Was this chapter helpful?
Let us know and help us improve the guides!
|