|
|
Using OSM Data in QGIS
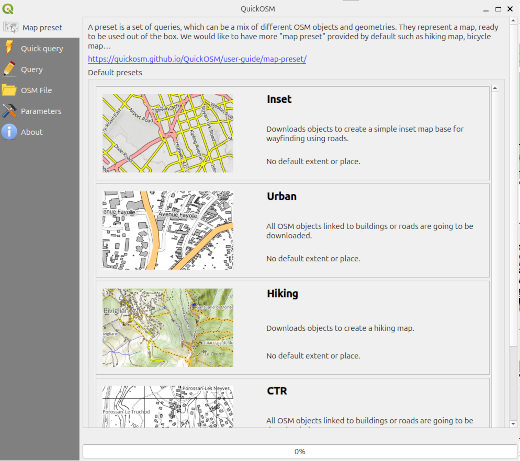
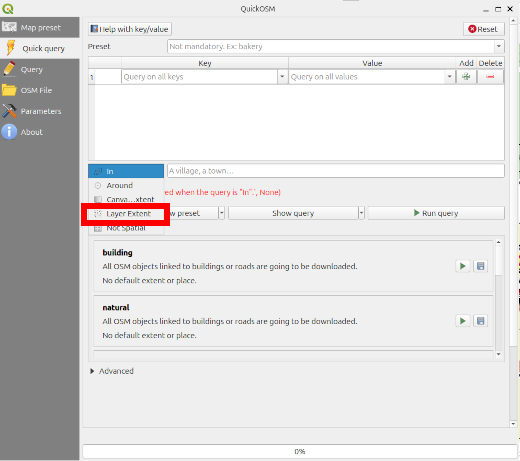
QGIS (formerly Quantum GIS) is a full-featured, open-source, cross-platform Geographic Information System. With QGIS you can access up-to-date OSM data whenever you want, select the tags you want to include, and easily export it into an easy-to-use SQLite database or Shapefile. In this chapter we’ll walk through the steps necessary to do this. We assume that you’ve already downloaded and installed QGIS 3.x. If you haven’t already done this, you can download it from http://www.qgis.org/en/site/forusers/download.html. We will use a plugin, QuickOSM, to import data from the OpenStreetMap database. To install this plugin open the Manage Plugins dialogue from the Plugins menu. Search for QuickOSM and install it. This will add an entry to the Vector menu Obtaining Data from the DatabaseThe first thing we will do is get some up-to-date OSM data. We can do this in numerous ways. The QuickOSM plugin allows us to extract large amounts of data as it uses the Overpass api and not the main OSM database server.
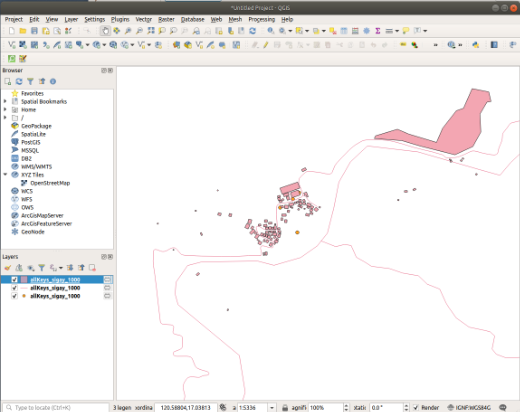
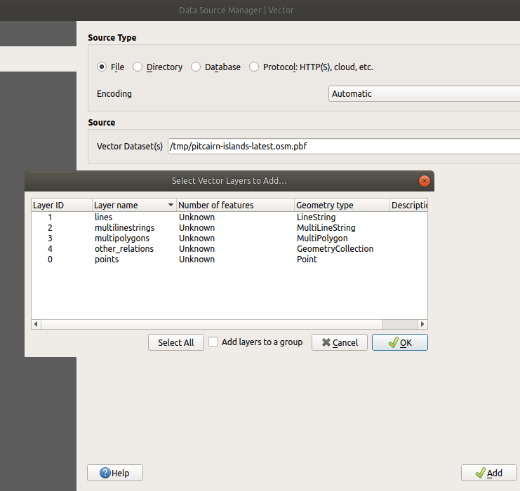
Importing extractsThere are several options how to obtain ready-made extracts of an area. https://wiki.openstreetmap.org/wiki/Planet.osm#Country_and_area_extracts contains a list of several websites. Just pick a .osm or .pbf file and download it. You can either use QuickOSM to import it clicking on ‘OSM File’ in the left bar. Once you used QuickOSM OSM files should have been made known to QGIS and you can use the regular vector layer import:
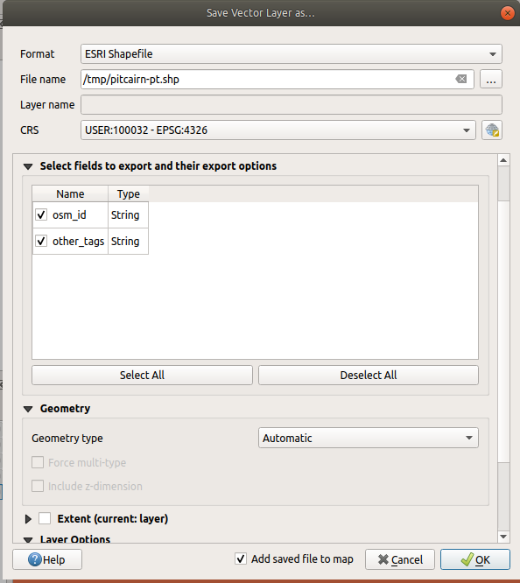
Exporting dataTo export a layer activate its context menu and select Export -> Save Features as… You can select from a wide range of formats including Shapefile, GeoJSON, PostgreSQL dump, SQLite. The other options on the dialogue vary depending on the format you selected.
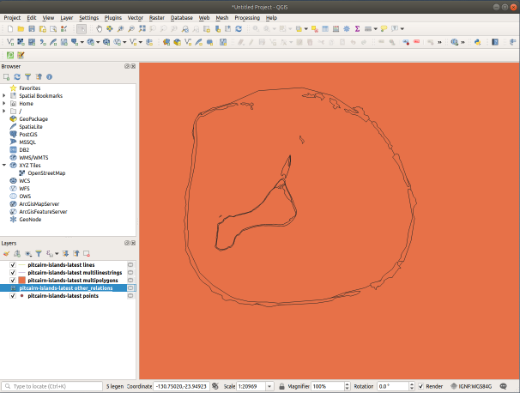
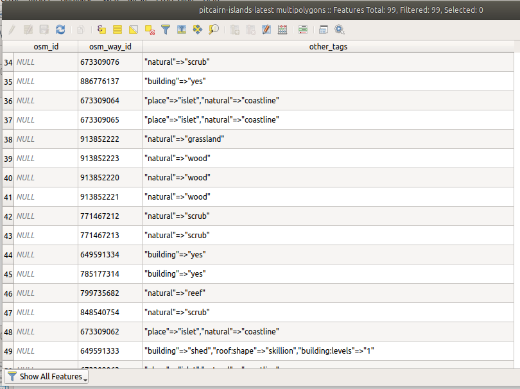
You can choose to re-import the exported layer by checking the box at the bottom (activated by default). Working with the DataWe cannot give you even a rough overview over what you can do with QGIS and there are many excellent tutorials and books which will guide you step-by-step towards mastering the software. But as OSM data imported by one of the methods described above have their tags encoded in a special way here is an example how to deal with them (for the curious, the example is pitcairn-islands-latest from Geofabrik’s download page for Australia and Oceania). You can inspect the data of a vector layer using ‘Open Attribute table’ from the context menu of a layer, in this case the multipolygon layer.
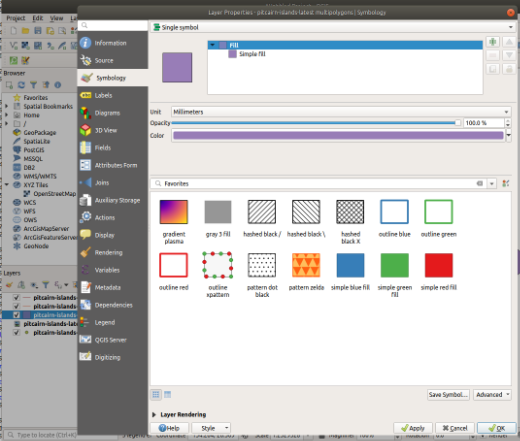
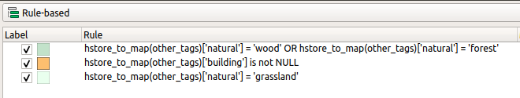
We can see that all the key-value-pairs for the tags of the various objects are organized in a specially formatted text string in the field ‘other_tags’. This kind of storage is called “hstore” in a PostgreSQL database and is the standard for OSM data. In this example polygons are mostly islands, forest and buildings. Initially they are rendered in the same way which means that islands cover everything else. Let us render them differently in order to get a feeling how to identify different objects. Discard the attribute table. From the context menu of the multipolygon layer select Properties and on that form move to the Symbology tab.
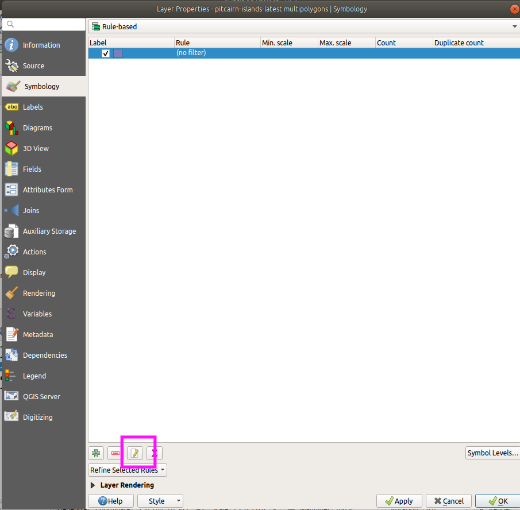
First change the type of the symbol from “Single symbol” to “Rule based” using the combobox at the top of the form.
The current rendering appears as a rule with no filters. We can modify this rule by clicking on the icon marked with a purple square in the image above.
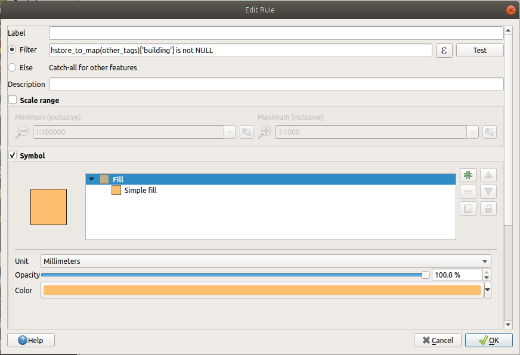
We’d like to treat buildings differently. Treat differently means that rules need to be specified according to layer properties. QGIS’ expression evaluation cannot directly deal with hstore strings. But a utility comes to our rescue and the filter expression shown in the image
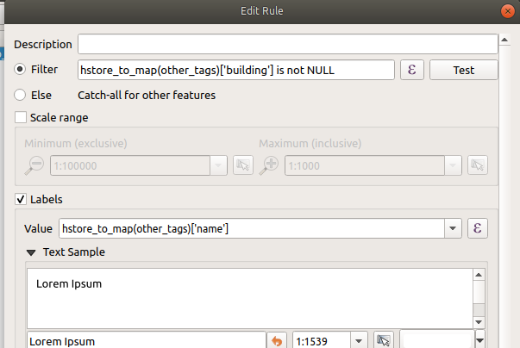
As an added bonus we can get a quick feature count for the rules. Press the rightmost icon in the row at the bottom (the sum symbol) and the ‘count’ column will be populated telling us that we have 150 buildings on this layer. You can add labels in a similar fashion how we dealt with symbols. ‘Labels’ is another tab on the properties of a layer, right below Symbology. In most cases you want to print the given name of a feature. You enter an expression similar to the ones used for symbology in the field for a filter and as value you would use
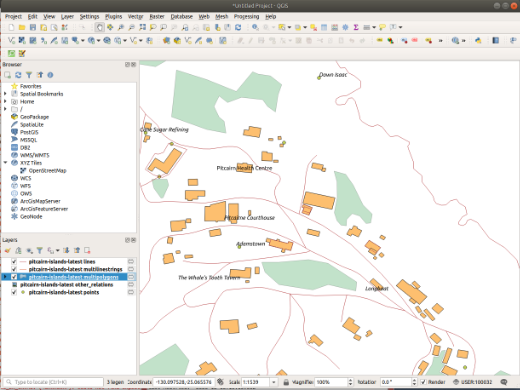
Assigning such labels to the multipolygon and the point layers you will end up with something like this:
SummaryThis process makes it easy to get up-to-date OSM data and pull it into QGIS. Once you have layers like this in QGIS, it is possible to save them as shapefiles, execute filters and queries, and so forth. For more detail on these functions see the Help menu in QGIS.
Was this chapter helpful?
Let us know and help us improve the guides!
|